RoadmapBench
🏆 Claude-Opus-4.7: 39.1% · Coding
Can coding agents implement real version upgrades? RoadmapBench evaluates frontier models on 115 multi-target tasks spanning 17 open-source repositories and 5 programming languages.
Leaderboard
Below is the resolved rate across frontier models on the OpenHands scaffold. Resolved % measures the fraction of tasks where all targets pass (full reward). Hover over each bar for detailed metrics including completion score, average interaction turns, and token usage.


Full Results
| # | Model | Scaffold | Resolved % | Completion Score | Turns | Tok. |
|---|---|---|---|---|---|---|
| 1 | Claude-Opus-4.7 Anthropic | OpenHands | 0.692 | 140 | 44K | |
| 2 | Claude-Opus-4.6 Anthropic | OpenHands | 0.627 | 141 | 42K | |
| 3 | GPT-5.4 OpenAI | OpenHands | 0.497 | 171 | 93K | |
| 4 | Gemini-3.1-Pro Google | OpenHands | 0.439 | 133 | 26K | |
| 5 | DeepSeek-V4-Pro DeepSeek | OpenHands | 0.486 | 140 | 64K | |
| 5 | GLM-5.1 Zhipu AI | OpenHands | 0.453 | 163 | 38K | |
| 7 | Kimi-K2.6 Moonshot AI | OpenHands | 0.432 | 159 | 76K | |
| 8 | Mimo-V2.5-Pro Xiaomi | OpenHands | 0.440 | 156 | 66K | |
| 9 | Qwen3.6-Plus Alibaba | OpenHands | 0.424 | 150 | 47K | |
| 10 | Kimi-K2.5 Moonshot AI | OpenHands | 0.378 | 110 | 29K | |
| 11 | MiniMax-M2.7 MiniMax | OpenHands | 0.332 | 124 | 38K | |
| 12 | Qwen3.5-397B Alibaba | OpenHands | 0.383 | 111 | 35K |
How It Works
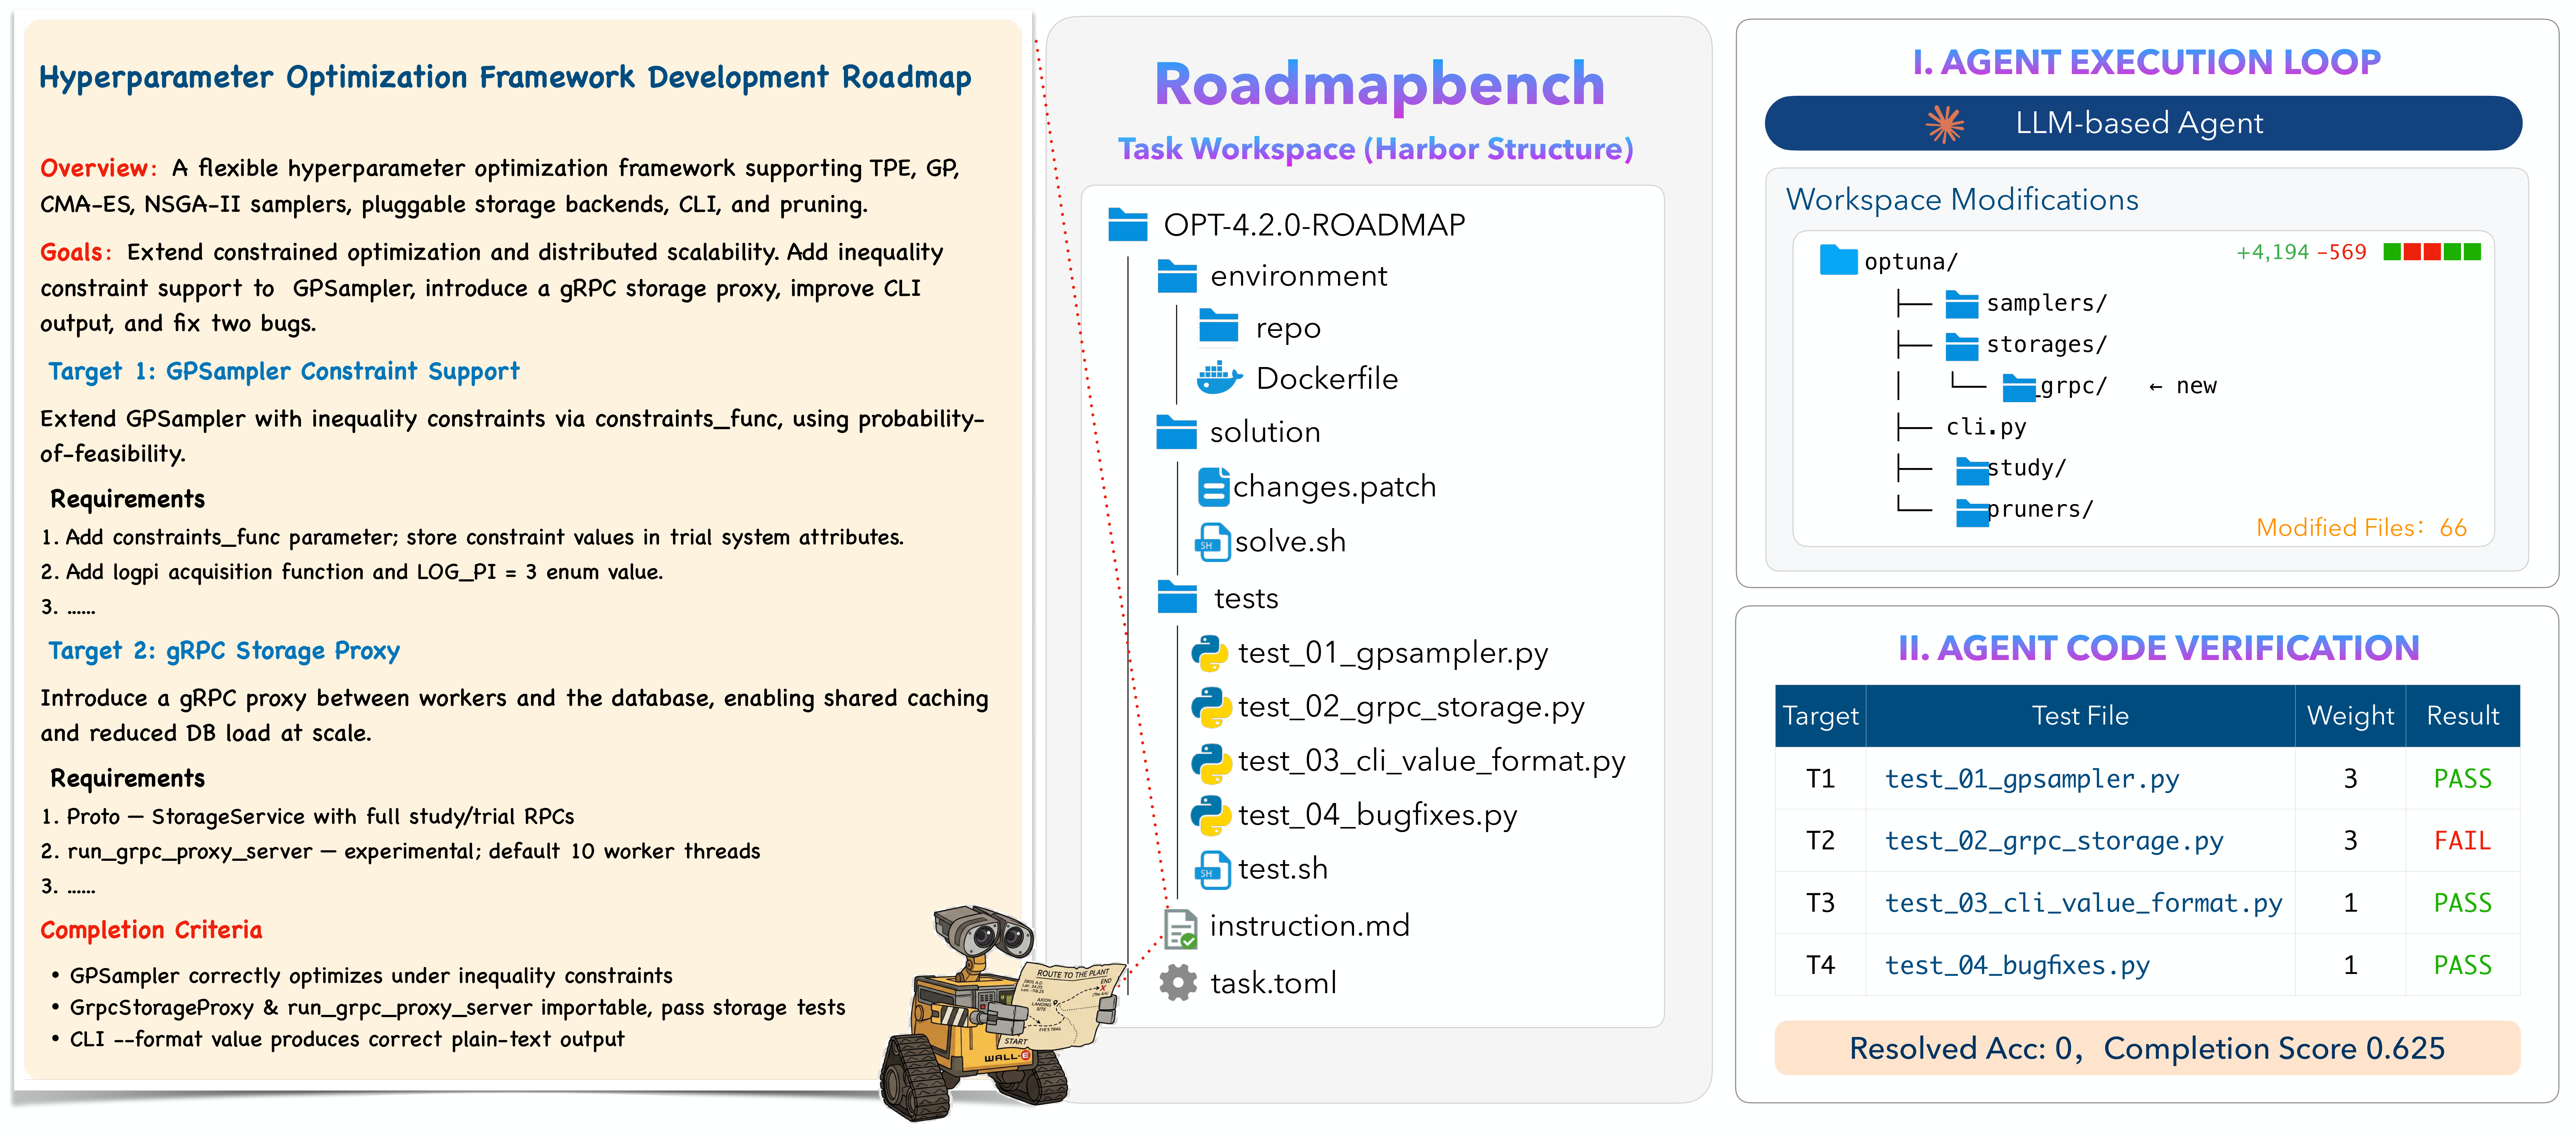
The agent receives a source-version repository snapshot and a multi-target instruction, then implements the specified functionality inside a pinned Docker environment. Evaluation is performed via weighted subtask-level tests against behaviors introduced in the target version.
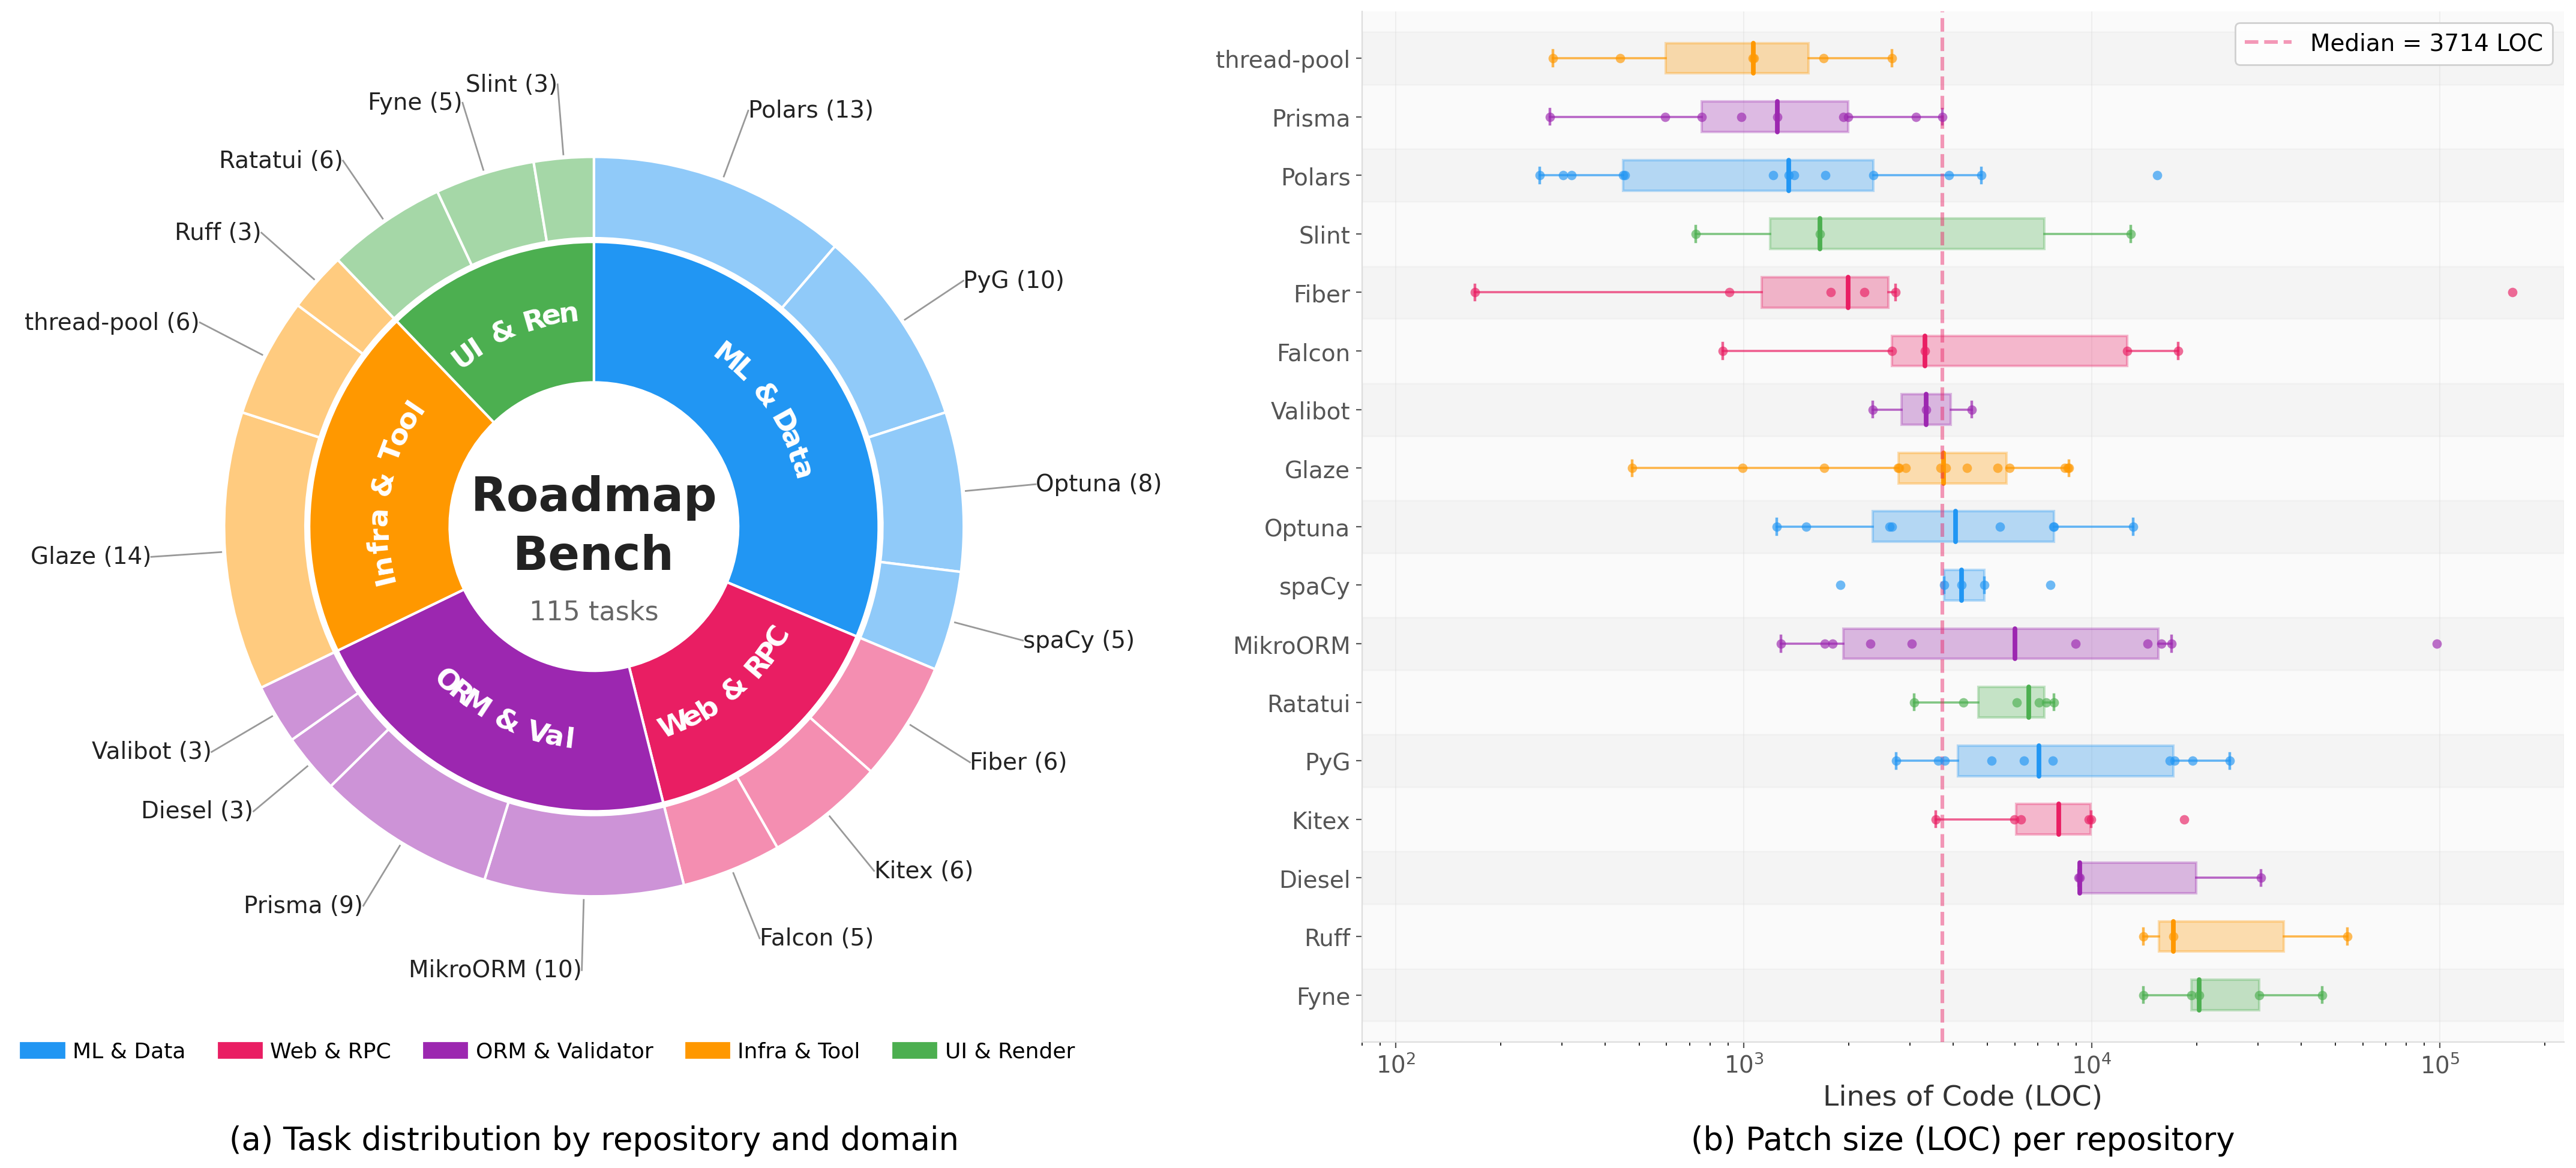
Dataset Overview
RoadmapBench covers 17 open-source repositories across 5 programming languages, organized into 5 domain groups. Oracle patches range from under 300 to over 30,000 lines changed, with a median of approximately 3,700 lines and 51 files touched per task.
Analysis
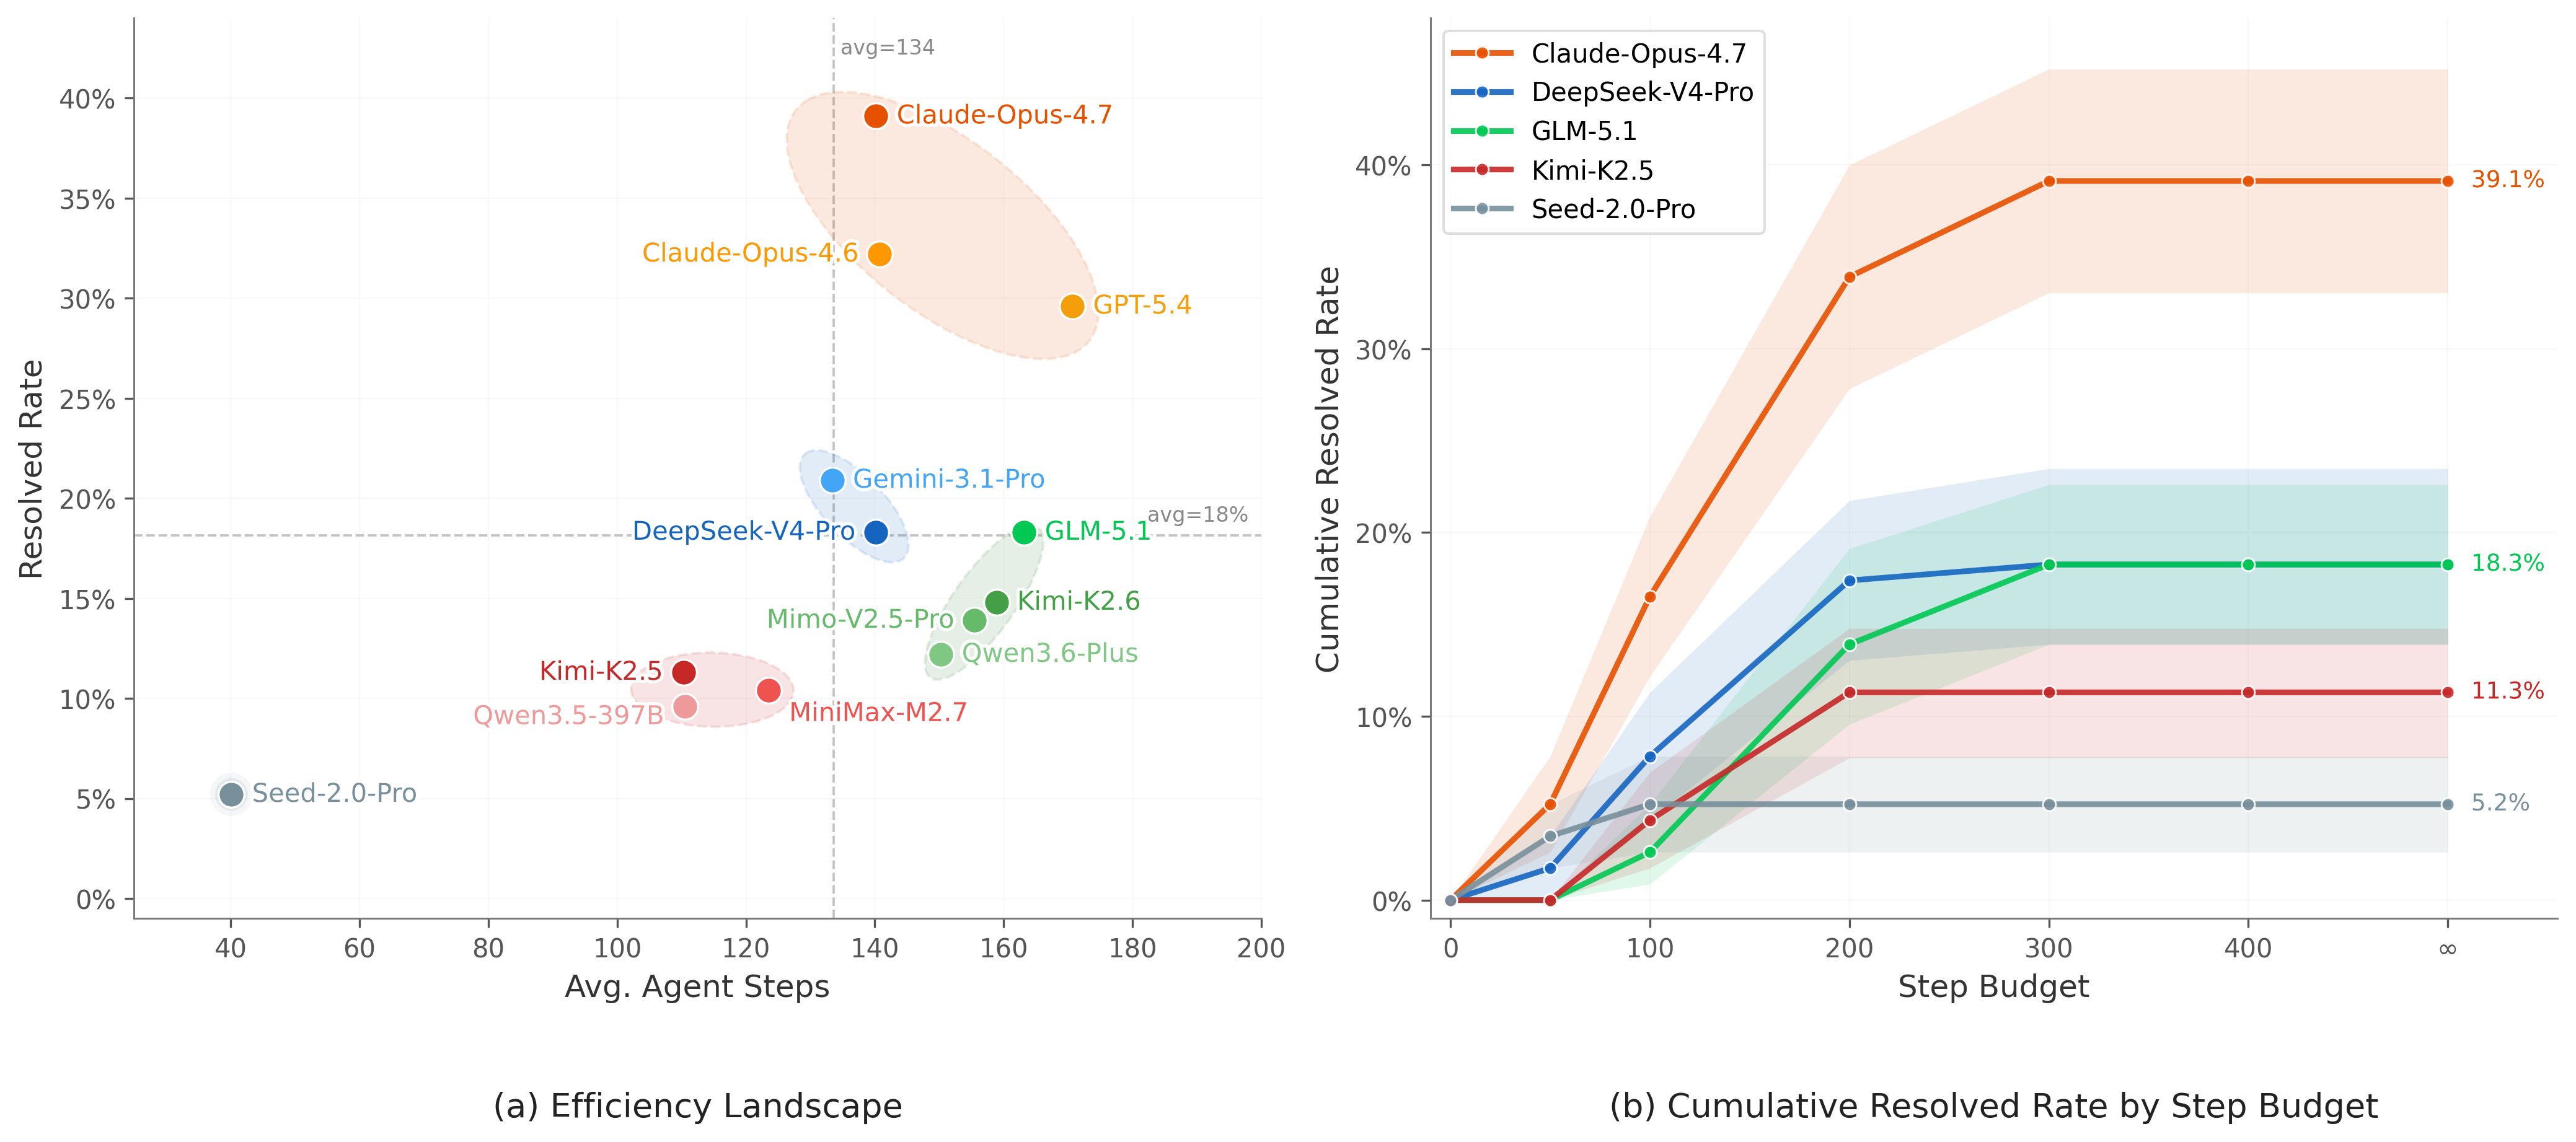
Step Efficiency & Compute Scaling
Frontier models (Claude-4.7, GPT-5.4) achieve 30–39% resolved with moderate step budgets. By contrast, models like GLM-5.1 and Kimi-K2.6 consume comparable or larger budgets but remain near mid-performance, indicating lower step efficiency. Most models plateau within 200 steps; Claude-4.7 is the main exception, continuing to improve beyond that threshold.
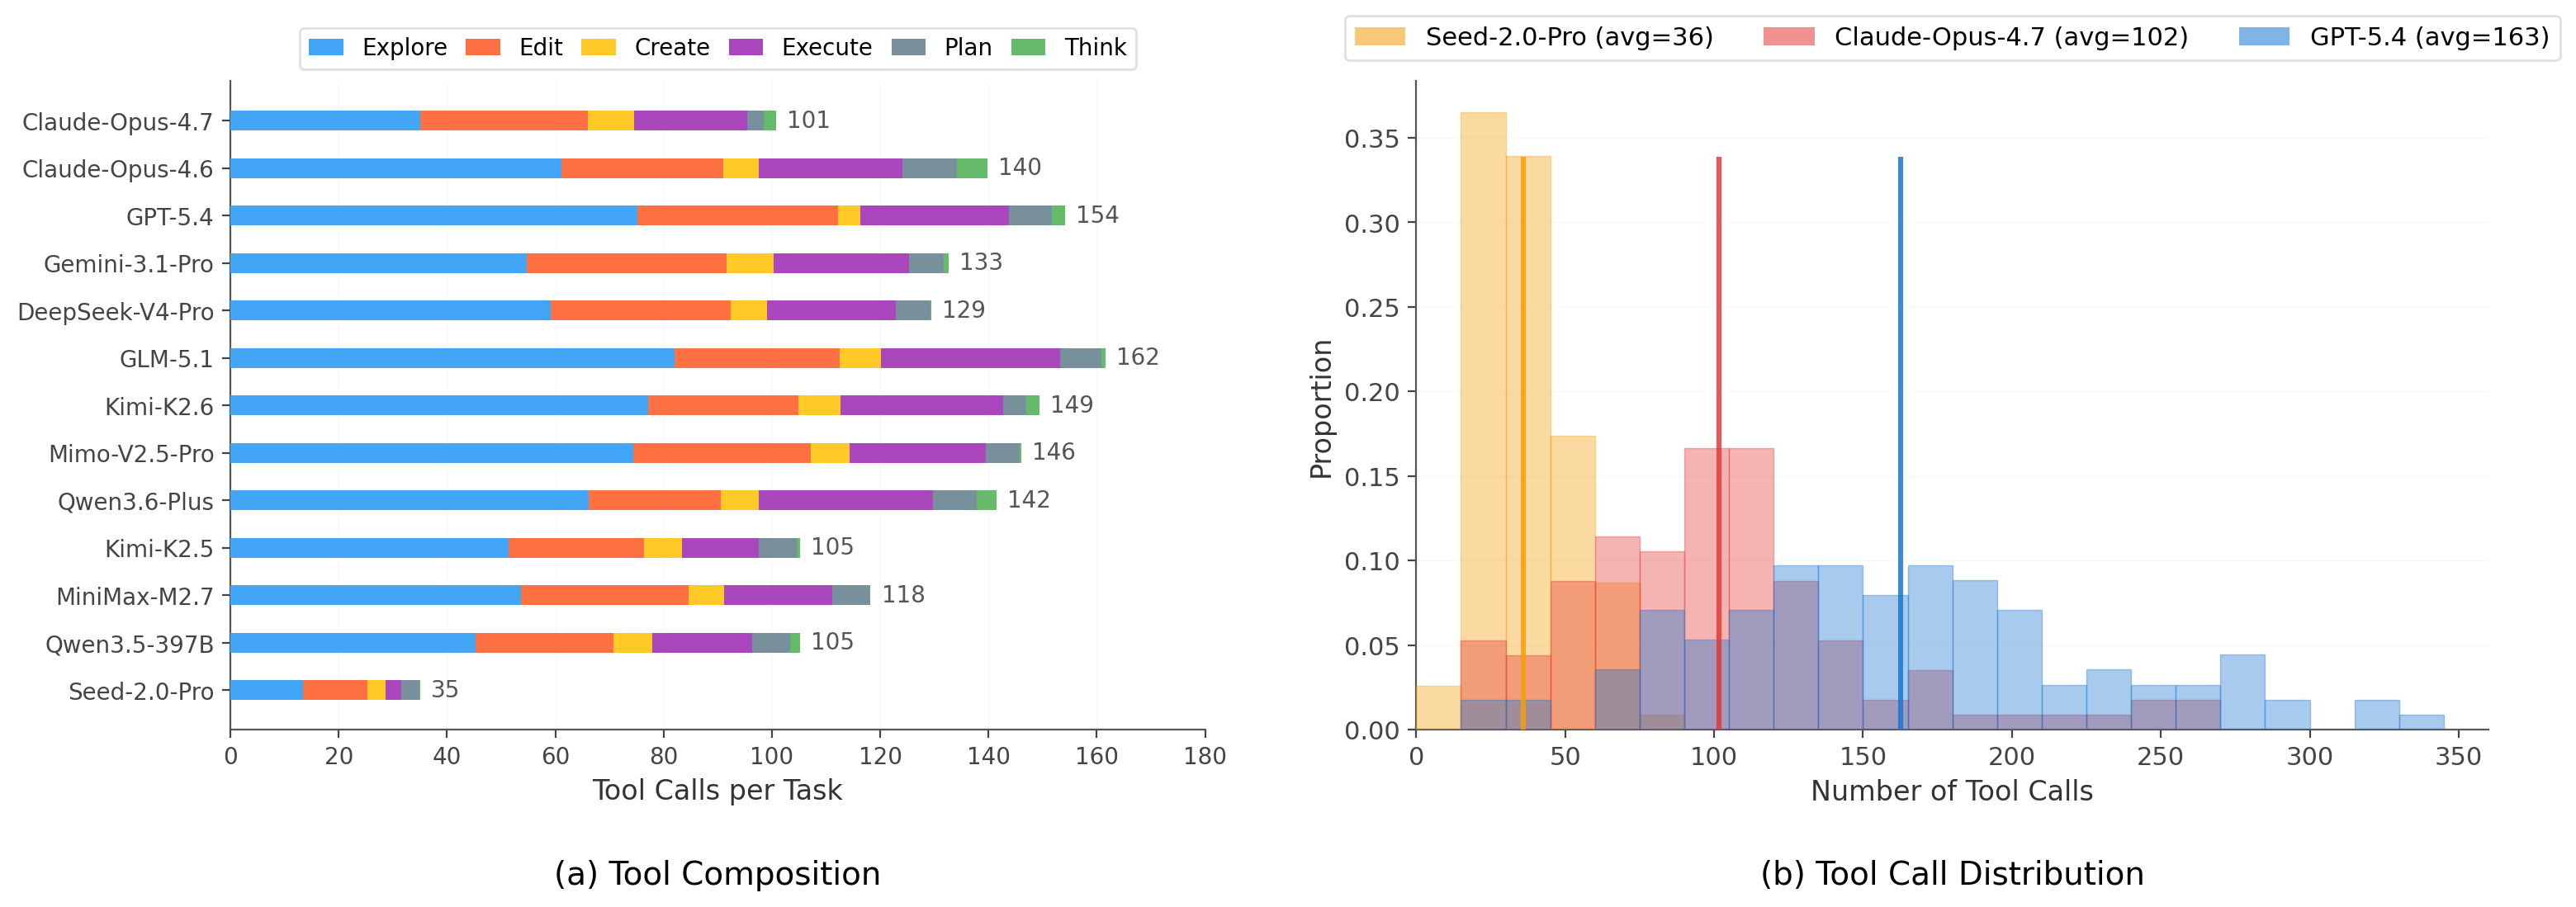
Tool Composition & Usage
Across all models, Explore, Edit, and Execute dominate tool usage. The key differentiator is allocation: Claude-4.7 achieves the highest resolved rate with the lowest Explore ratio (35%), indicating more efficient code localization. Weaker models spend over half their budget on exploration without translating it into successful edits.
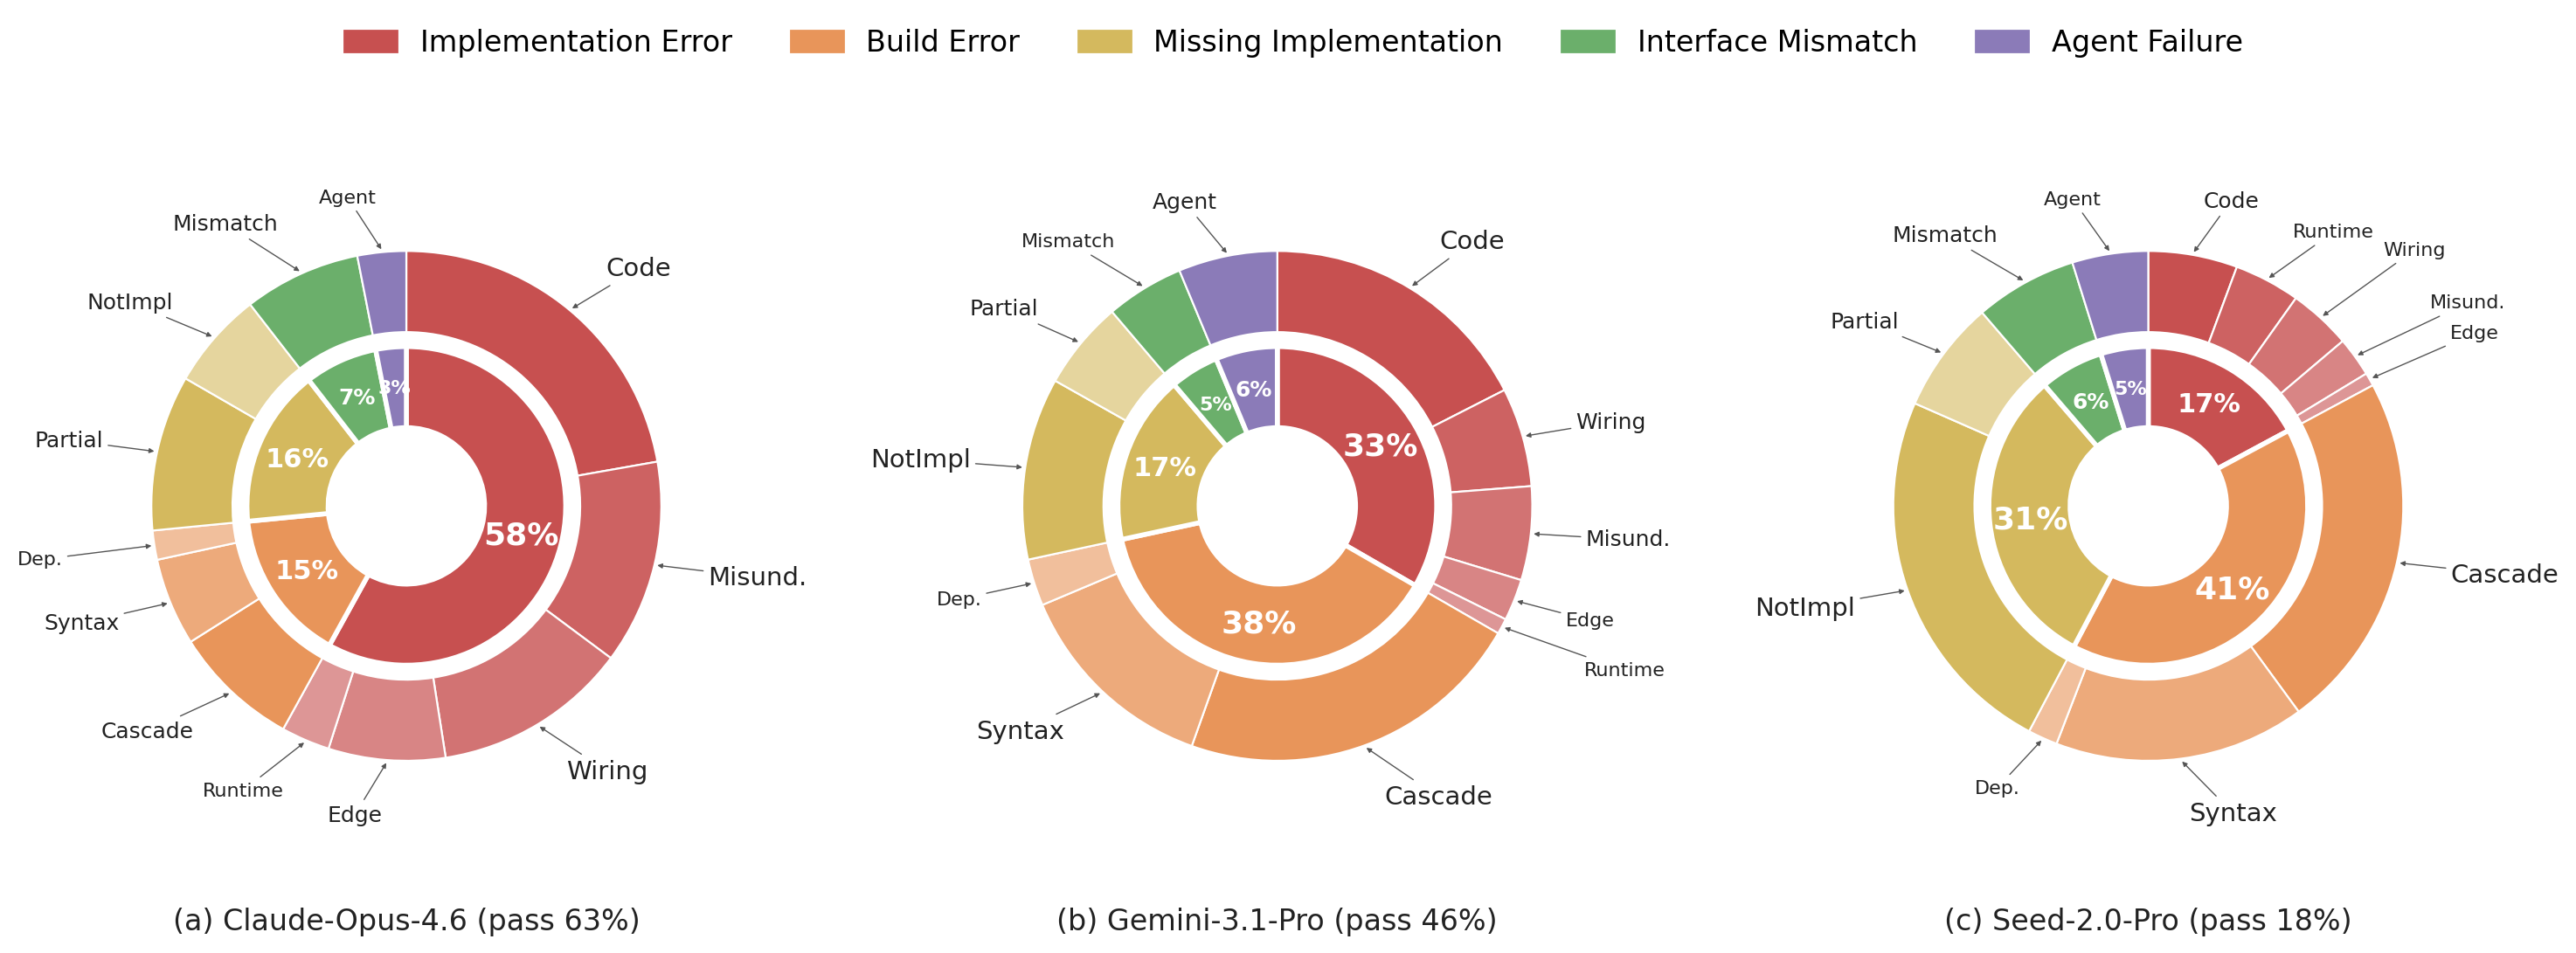
Failure Mode Analysis
As model capability decreases, the dominant failure mode shifts from Implementation Error (incorrect behavior in buildable code) to Build Error and Missing Implementation (incomplete or non-compiling code). For Claude-Opus-4.6, 58% of failures are Implementation Errors, dominated by code defects and requirement misinterpretation. For weaker models, Build Error and Missing Implementation account for over 70% of failures.
About RoadmapBench
Each task provides a repository pinned at an earlier release and a multi-target specification describing features from the target version. The agent implements these features without access to the target source code, test files, or oracle patch. Tests are adapted from official upstream test suites.
Quality assurance uses attribution-driven failure classification (T-type vs M-type). Only tasks where all task-side defects are resolved are admitted, ensuring remaining failures reflect genuine model limitations.